Measuring the World
Through this seminar, we gained an understanding of how data can be captured using today’s technologies. This can be done by using sensors to measure changes in the physical world. Also, we can use structured data sets and access, connect, and modify them according to our needs.
Group Project — Engagers
Providing IAAC with schedule optimization insights for MDEF
We ideated on multiple directions we can take as a team and oriented the conversation towards ways in which we can measure class engagement.
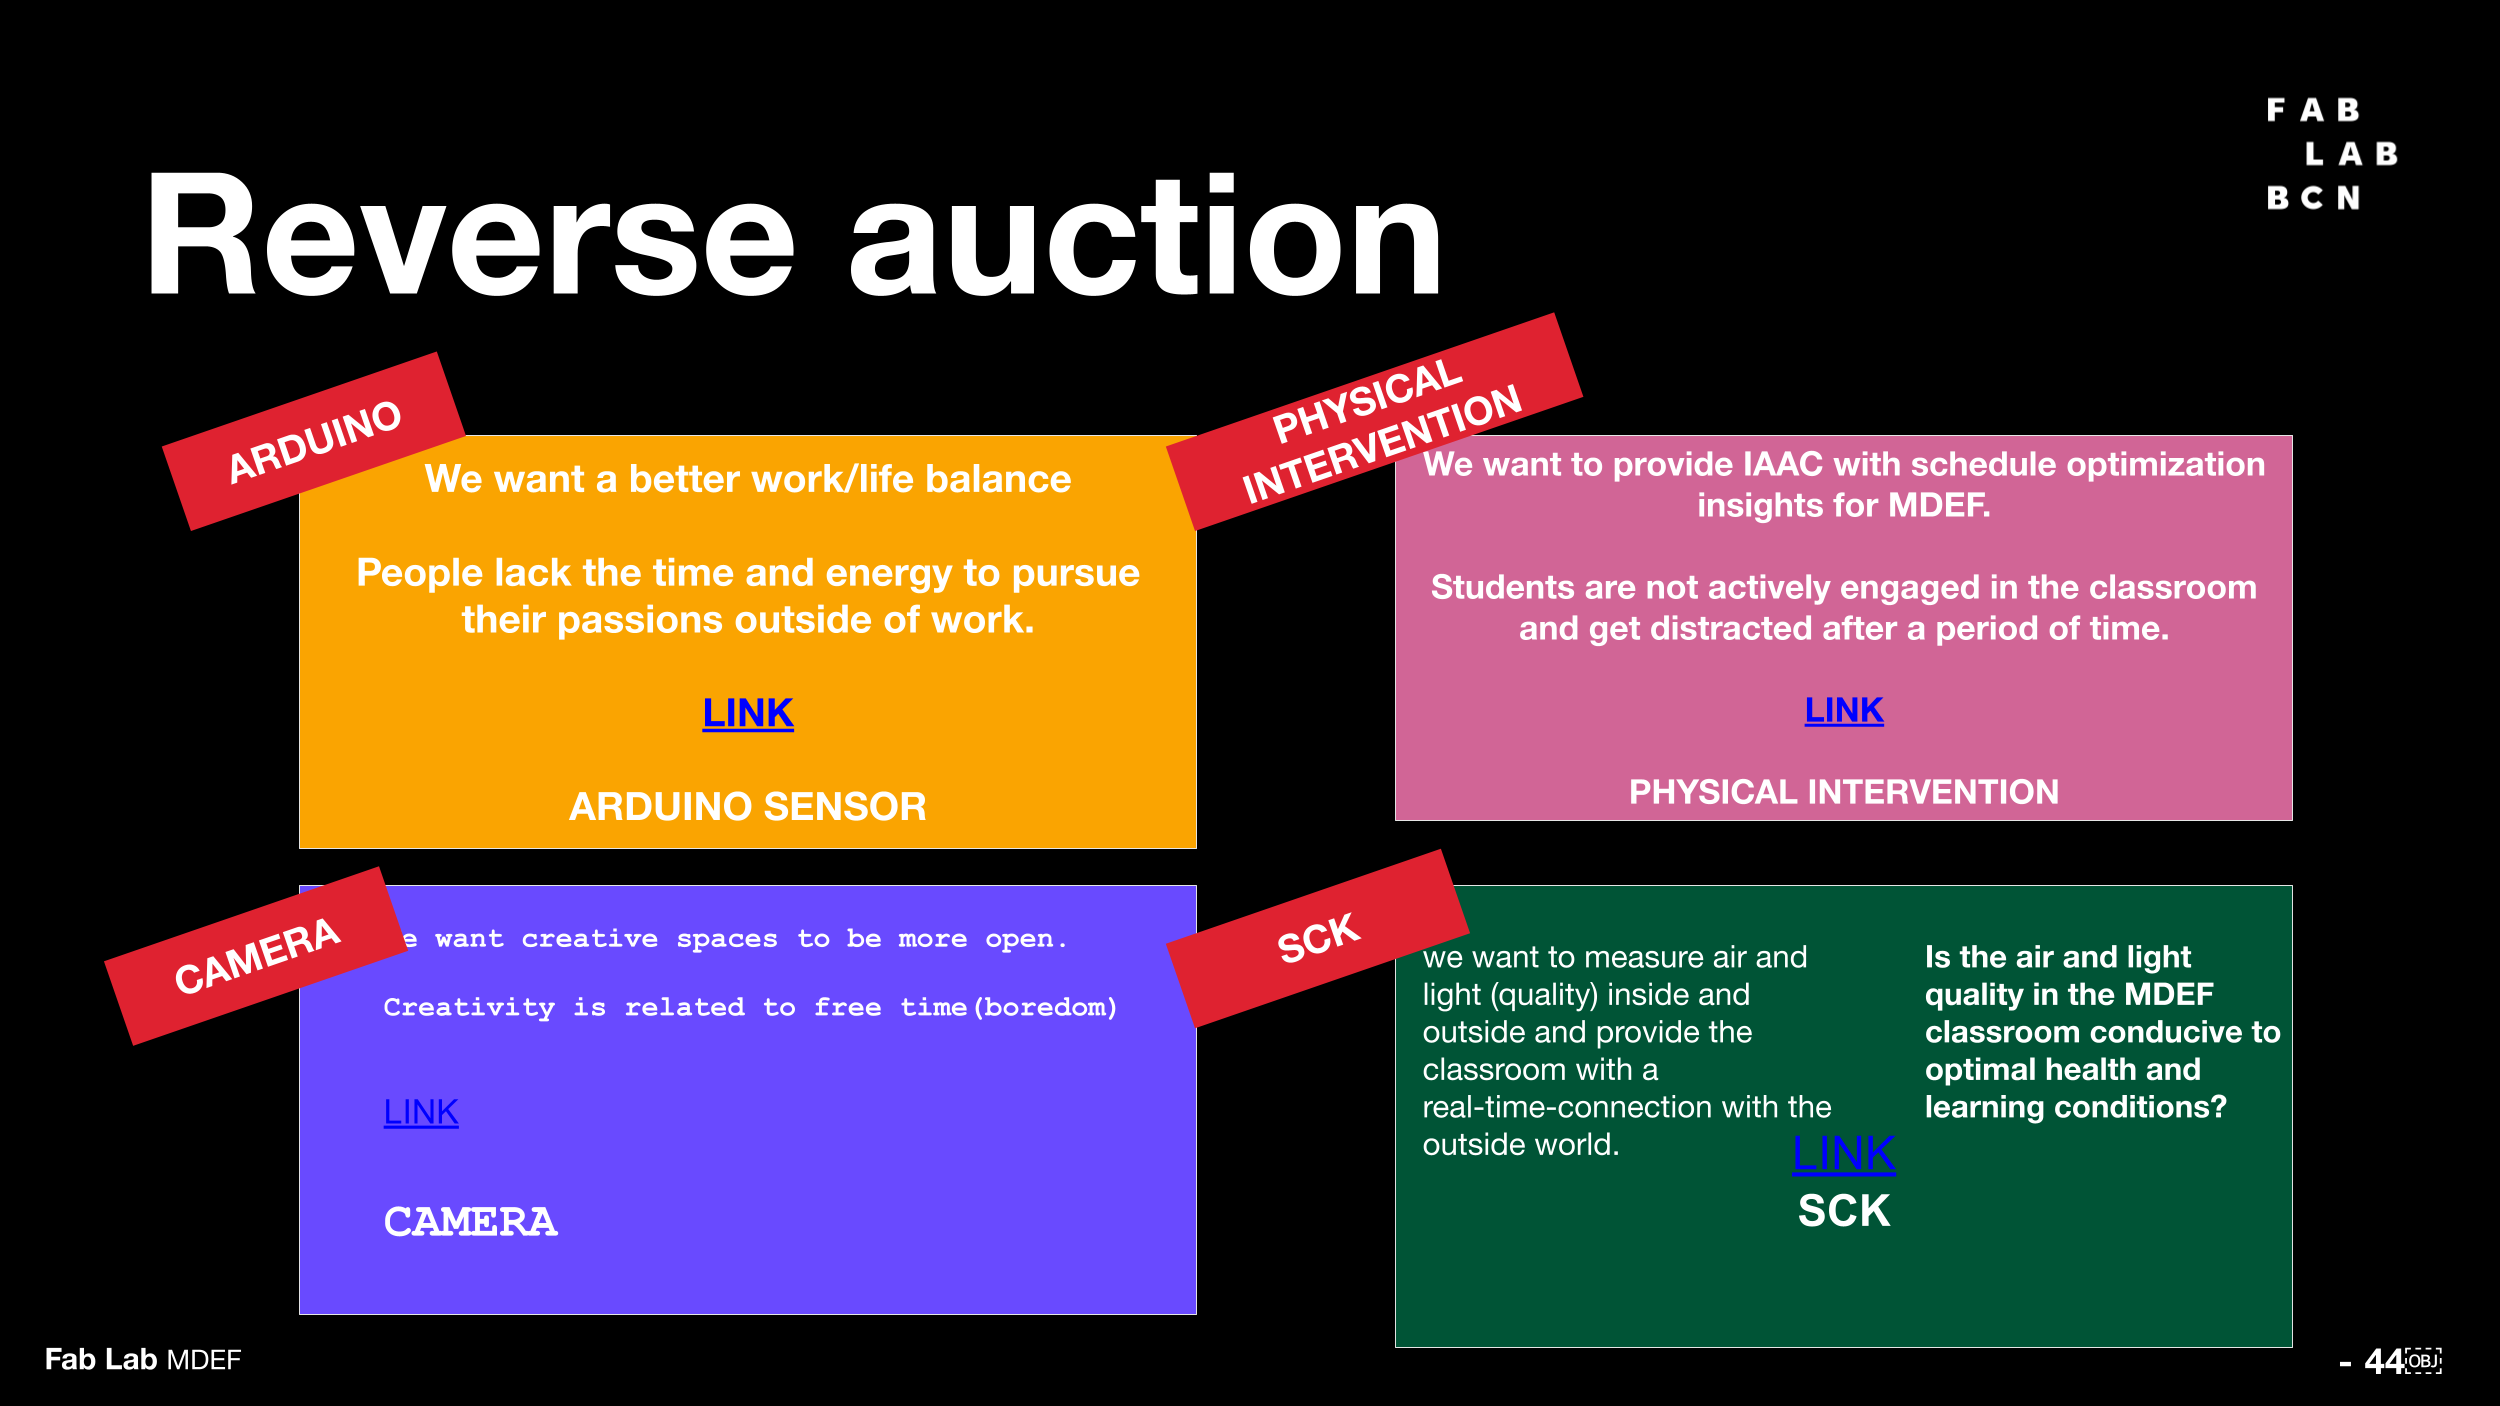
Objective: We want to provide IAAC with schedule optimization insights for MDEF.
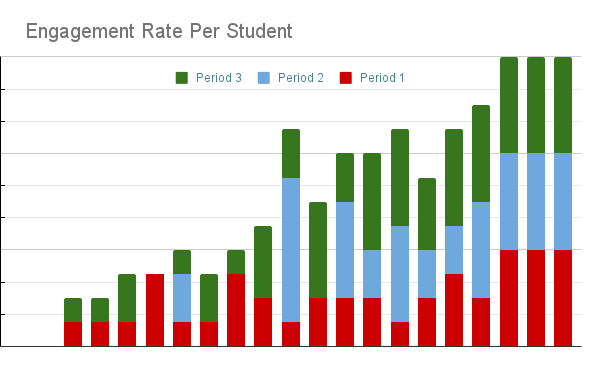
Question: Does the level of student engagement change during a lecture?
Hypothesis: Students are not actively engaged in the classroom and get distracted after a period of time.
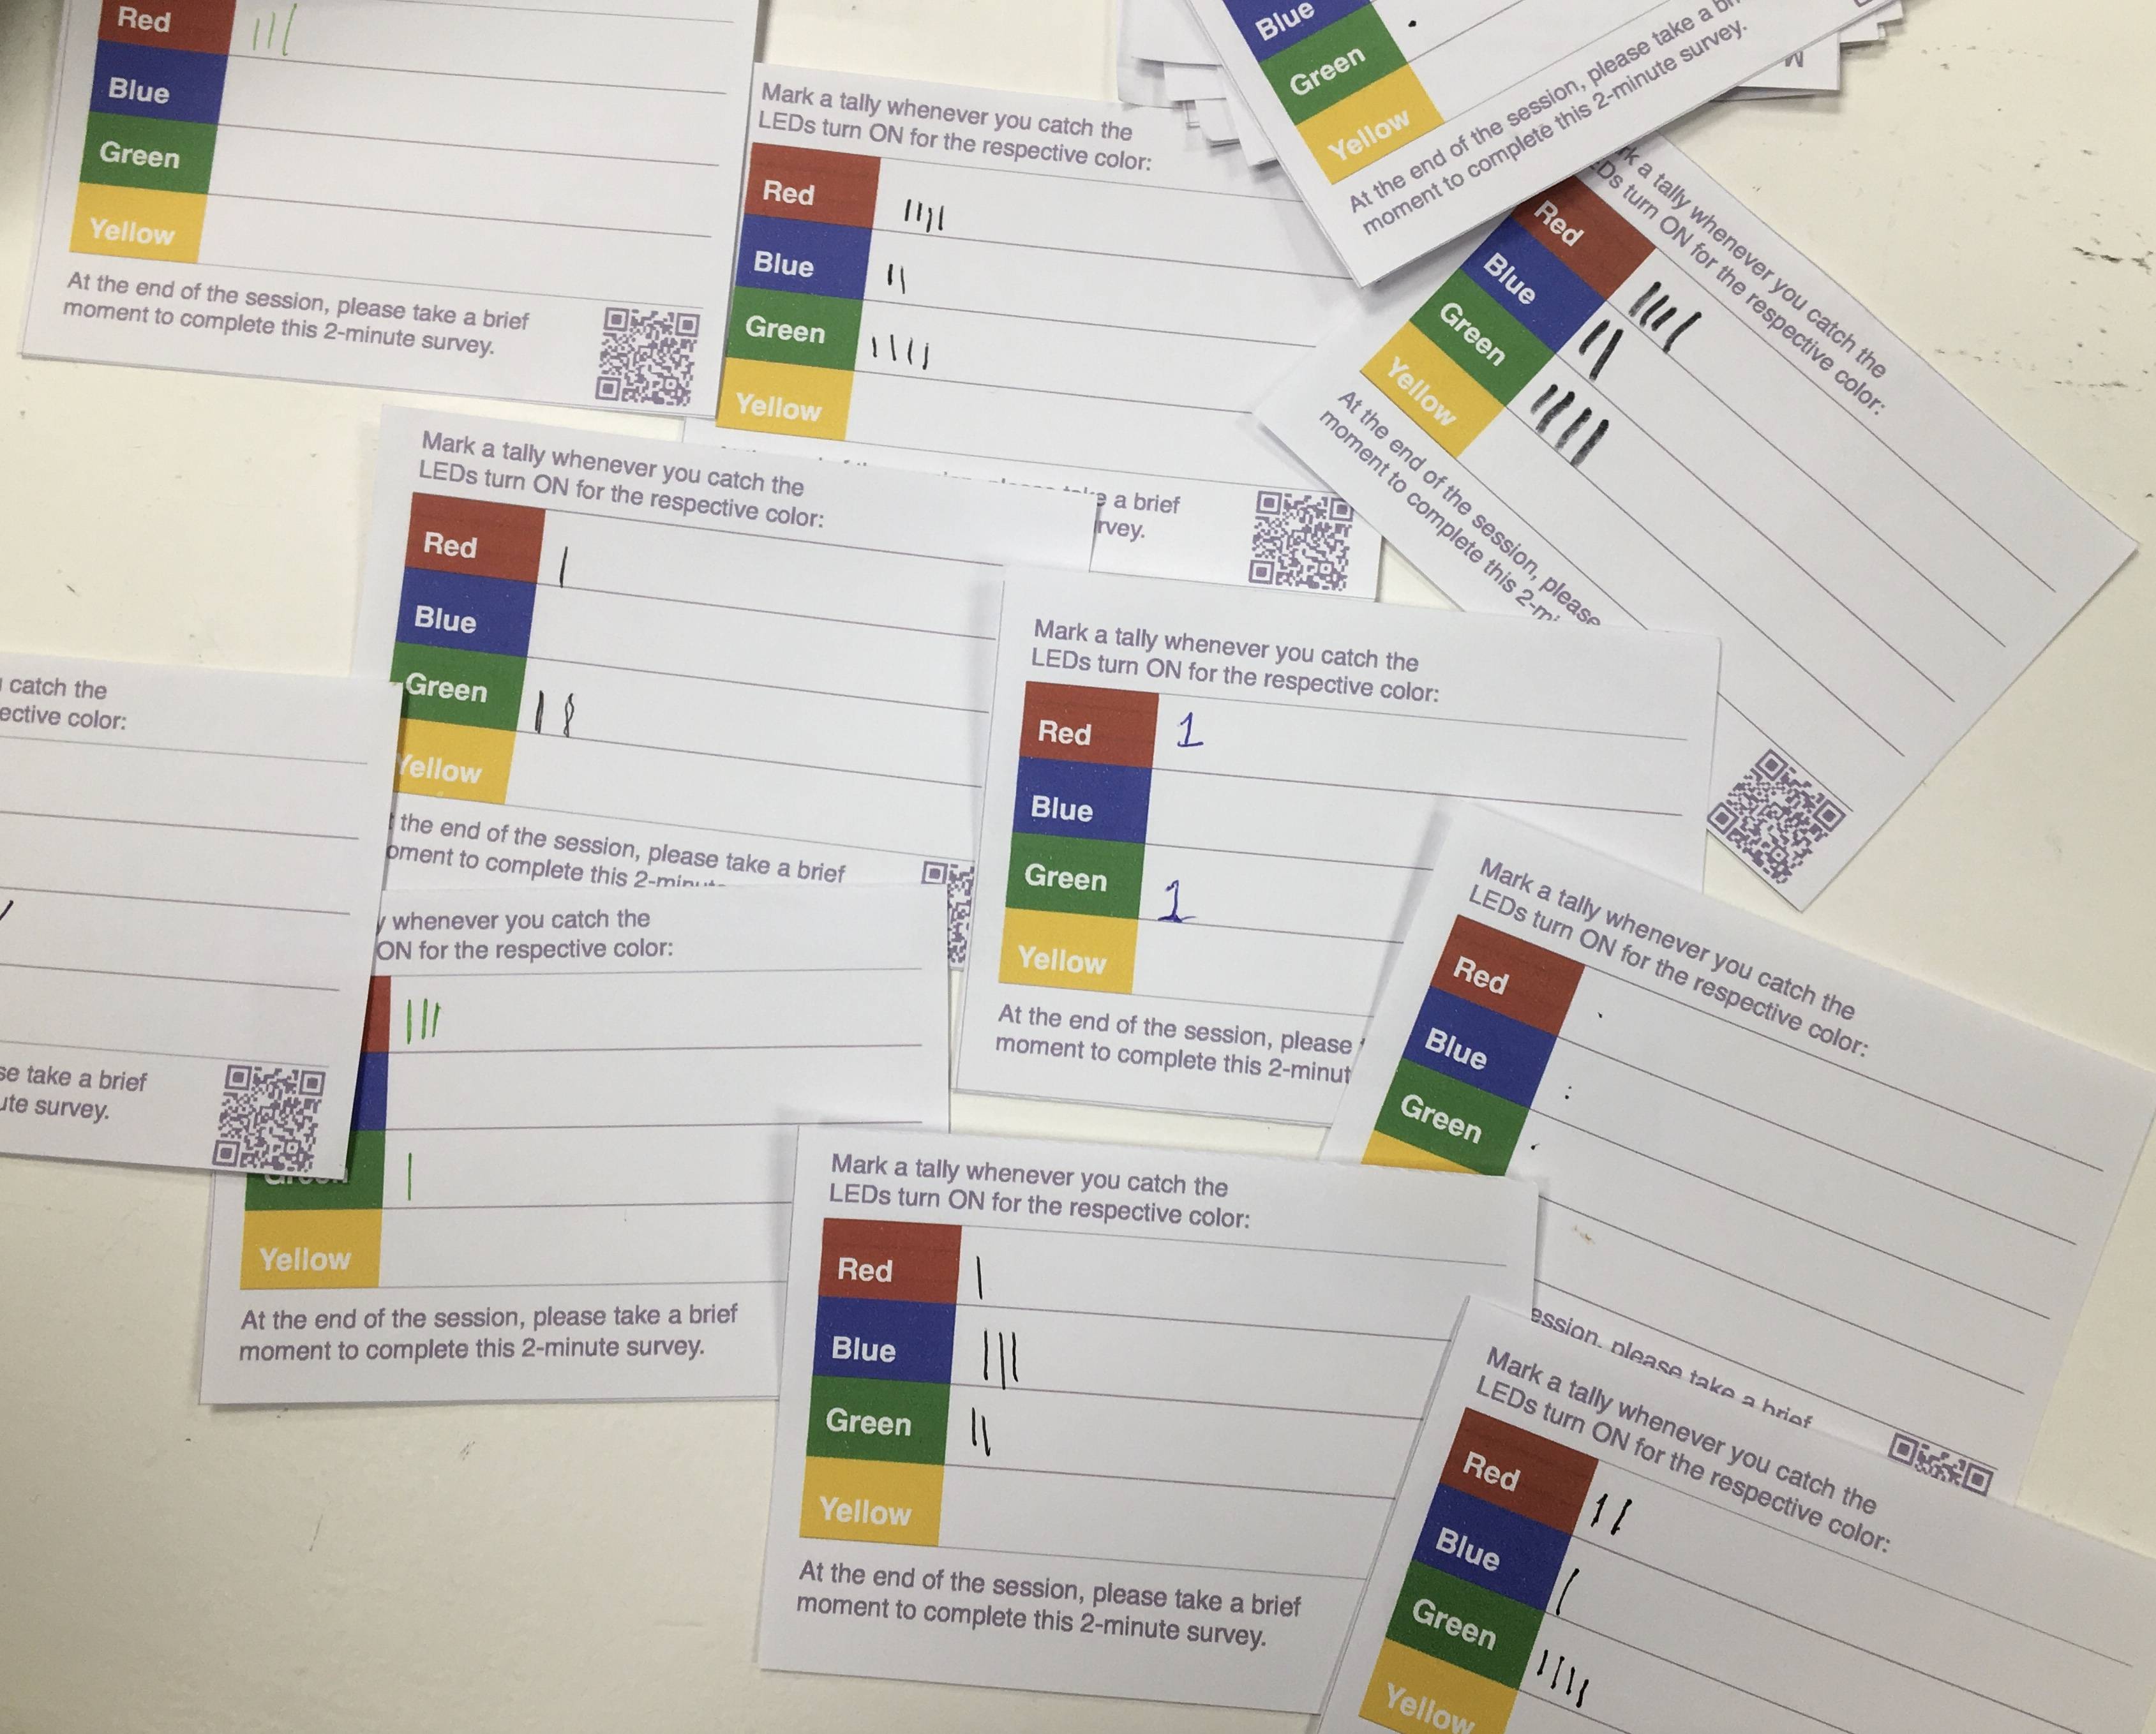
We decided to optimize the schedule of MDEF through the use of a physical intervention. By placing lights that would randomly blink throughout the course of the class, we were hoping to identify the levels of engagement of our students, in comparison to the timeline of the class.

We documented our findings on our hacked note, which can be accessed here: https://hackmd.io/V5oxTmRXTGC1IJY0ac_oAw


Reflections
-
The course on data provided an in-depth understanding of data collection, analysis, and visualization, and its critical difference from information.
-
The group appreciated the opportunity to study engagement in their local context and analyze it collectively during presentations, considering both data and personal insights from community members.
-
From a fabrication point of view, the coding aspect to this prototype was interesting, and the prototype impacted their attention and made them engage with the necklace even more.
-
The group project aimed to optimize the schedule of MDEF by analyzing classroom engagement levels, using an LED necklace and manual data collection from students.
-
The tool has biases that affect the efficiency of measuring engagement correctly.
-
Challenges were identified in measuring engagement in the physical world compared to the digital realm.
-
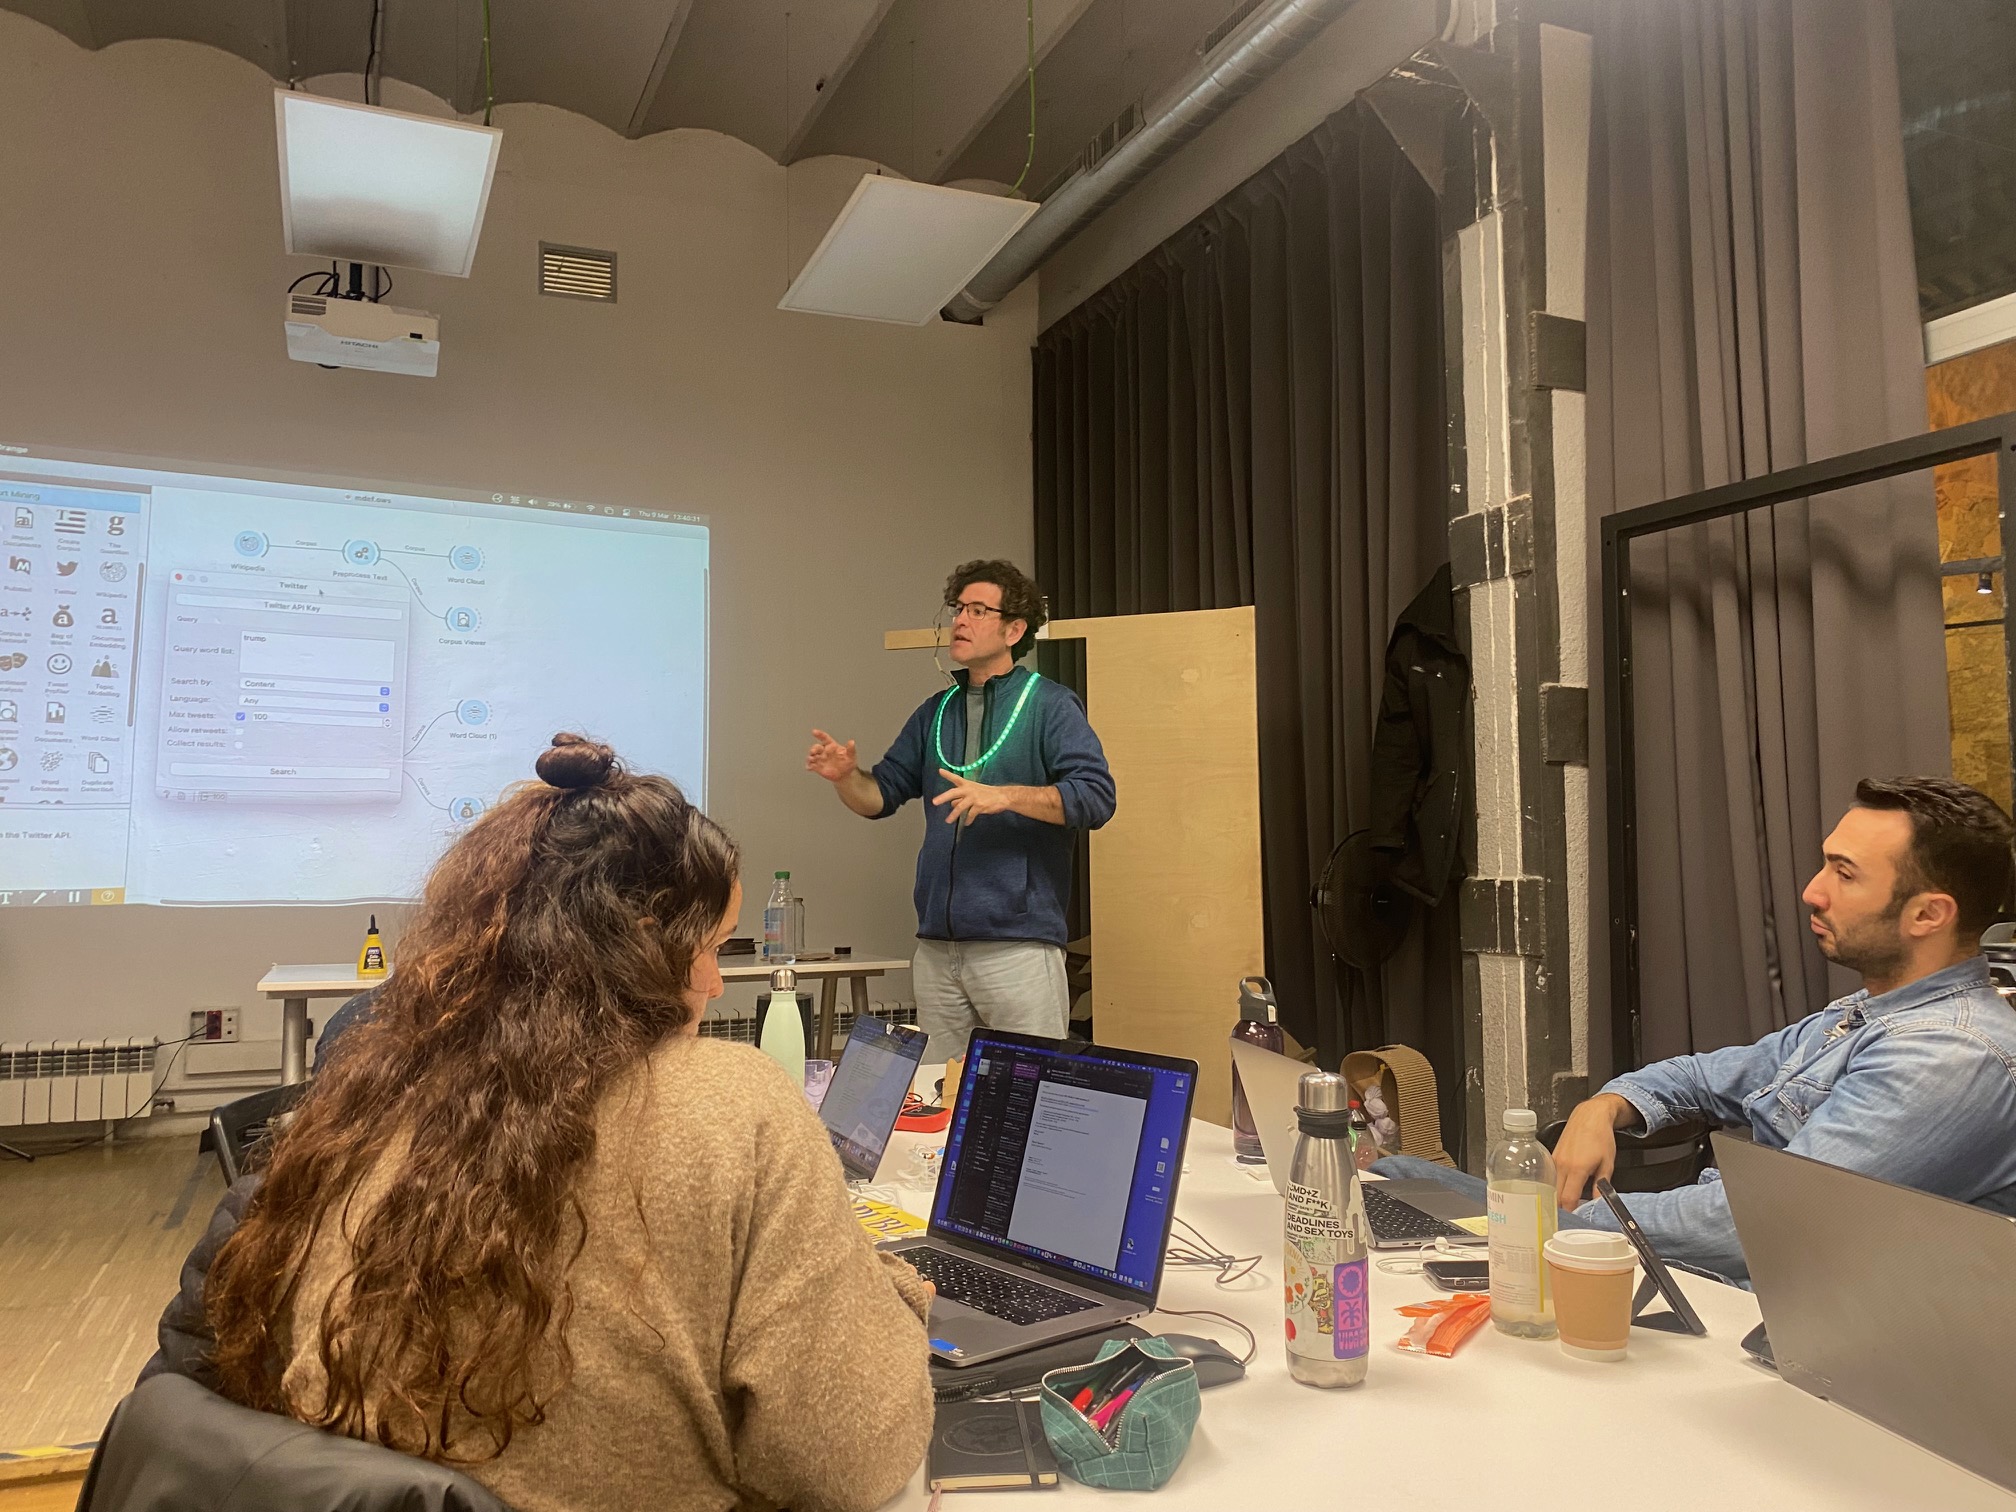
Orange3 was used as a tool to analyze and visualize the data, which was exciting and insightful.